pez: Phylogenetics for the Environmental Sciences

You’re not famous until they put your head on a pez dispenser. Or something. Image from pez.com; hopefully advertisement isn’t copyright infringement…

I have a new R package up on CRAN now (pez: Phylogenetics for the Environmental Sciences). We worked really hard to make sure the vignette was informative, but briefly if you’re interested in measuring:

  • a combined data structure for phylogeny, community ecology, trait, and environmental data (comparative.comm)
  • phylogenetic structure (e.g., shape, dispersion, and their traitgram options; read my review paper)
  • simulating phylogenies and ecological assembly (e.g., scape, sim.meta, ConDivSim)
  • building a phylogeny (phy.build)
  • applying regression methods based on some Jeannine Cavender-Bares and colleagues (eco.xxx.regression, fingerprint.regression)

…there’s a function in there for you. For what it’s worth, I’m already using the package a lot myself, so there is at least one happy user already. I had a lot of fun working on this, mostly because all the co-authors are such lovely people. This includes the people who run CRAN – I was expecting a hazing for any kind of minor mistake, but they’re all lovely people!

I learnt a few things while getting this ready to go which might be of interest if, like me, you’re very naive as to how to do collaborative projects well. I don’t think much of this is R-specific, but here are things that I was surprised by the importance of…

  • People are sometimes too nice.
    • So you have to needle them a bit to be constructively nasty. Some (I’m looking at you, Steve Walker) are so nice that they feel mean making important suggestions for improvements. Some  feel things are lost in writing them down and prefer talking over Skype (e.g., me), others are quicker over email.
    • Everyone has different skills, and you have to use them. Some write lots of code, others write small but vital pieces, some check methods, others document them, and some will do all of that but be paranoid they’ve done nothing. Everyone wants to feel good about themselves, and if you don’t tell them what you want from them, they won’t be happy!
  • Be consistent about methods.
    • I love using GitHub issues, but that meant the 5% of the time I was just doing something without making an issue about it… someone else was doing the same thing at the same time. Be explicit!
    • If you’re going to use unit tests make sure everyone knows what kind of tests to be writing (checking values of simulations? checking return types?…), and that they always run them before pushing code. Otherwise pain will ensue…
    • Whatever you do, make sure everyone has the same version of every dependency. I imagine at least one person has made some very, very loud noises about my having an older version of roxygen2 installed…
  • Have a plan.
    • There will never be enough features, because there will never be an end to science. Start tagging things for ‘the next version’; you’ll be glad of it later.
    • Don’t be afraid to say no. Some things are ‘important’, but if no one cares enough to write the code and documentation for it, it will never get done. So just don’t do it!

Will’s Library: how I store my papers

There is no cake. Who knows, maybe in 100 years time my library will develop sentiency. Maybe it won’t. This is a picture of GLaDOS, from the game Portal 2 – go play it, it’s fun. There we go, now this isn’t copyright infringement, it’s advertising.

Like every other scientist I’ve ever met, I constantly complain that I’m not reading enough. When I was a PhD student, I used DevonThink Pro (which I got for free as a student – smart move Devon!) to keep tabs on everything I’d read/needed to read, but when I switched to Linux I couldn’t use it anymore.

This started a ~two year search for a good way of handling all my papers. Before you all scream ‘Mendeley’ at me, I was an early-adopter (2009) and it deleted all my notes, and I have yet to find something else that I’m certain I could copy all my PDFs and notes out of with ease (which DevonThink let me do).

So, in a fit of irritation, I wrote my own program to store all my papers and notes. It’s very, very simple (which is the only reason I use it) – put all your PDFs in one folder (and maybe sub-folders within it), keep notes on them in a separate file (one paper per line), name your PDFs sensibly, and you’re done. I had very grand plans of making this an even bigger program with a web interface, etc., etc., but after arsing around with Sinatra (which, by the way, is great) I decided I didn’t need any of it.

So, if, like ~=90% of the scientists I’ve met, you’ve just got a big folder where you keep everything, or if, like me, you’re paranoid about using a structure that means you’ll never be trapped in a program, give it a go. On Linux, type ‘ctrl-alt-t’, then ‘wl -p pearse’ to see anything I’ve written that you bothered to keep, and ‘wl -p pearse -o 1’ to open the first/only of those papers. And yes, I know this is a very simple program, but this is probably the most useful thing I’ve written all year 😦

r2 of an r2 of r2s: progress in ecology

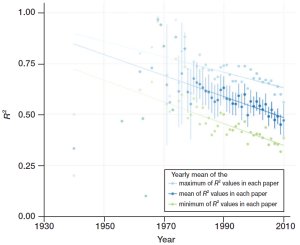
Like many, I read the recent paper about decreasing explanatory power in ecology with skeptical interest; it’s a cool paper and I guarantee it will make you think. The authors scraped a load of r2 and p-values from ecology papers over the last few decades, and plot the average r2 and count of p-values through time. They find that the average r2 (the explanatory power) of ecological studies is declining through time. I’m a bit of a fan of Bayesian stats, so I find the idea that p-values are a measure of hypothesis testing a bit galling, but I decided to take a look at the data for myself.

Below is their figure 3, which shows the trend in mean r2 through time, and has an r2 of 62%.

original

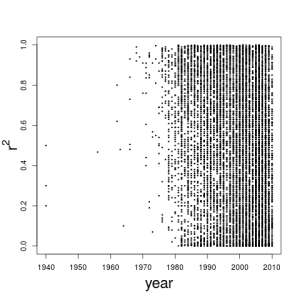
…which seems fine, until you open up the data it’s from and plot the data underlying those mean yearly numbers:

will_r_1

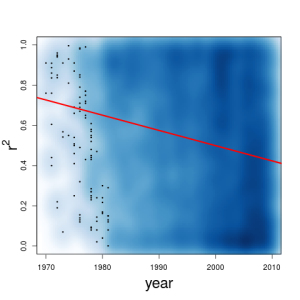
…which, to me, contains an awful lot of scatter that isn’t otherwise apparent. Let’s ignore the data before 1969 (although including them changes nothing substantial). Take a look at a density plot of the same data with a best-fit line through it:

will_r_2

Good news! The regression is still significant (it should be, there are 10,759 points in this plot…), but the r2 is 4%. 4% is quite a lot less than the 62% the authors obtained when they averaged out their variation at the year-level. The within-year variation is so large that I don’t think this decline, while statistically real, is something we could use to make predictions. The authors tried to control for this (I sense) in their regression by weighting according to how many values made up each average. I don’t think that goes far enough, because we have the original data to work with (why average), and sample size is not the same as confidence – it would be better to weight by the means’ standard errors. I’m also not convinced a mean (or linear regression) describes this kind of bounded data very well, but I could be convinced otherwise.

In summary, there is a decline in explanatory power in ecology, but the explanatory power of that decline (…) is small and so I don’t think we should get too worked up about it. By all means talk about what this decline means, but if the r2 of the r2s is 4%… do we need to freak out?

Nice guys fill niche space first

A picture of a NutNet site. I’ve no idea what site, or who took it, but it was part of the front page of the NutNet website where it was also unattributed, so I’m assuming no one minds me displaying it here too!

trait.space is based around a simple assumption: given a co-existence matrix of species (0–> species coexist always, 1–> species don’t co-exist at all) we should be able to plot all those species in 2-D space (i.e., on a piece of paper) and their distance be proportional to their coexistence. It’s perhaps not the most complicated model in the world, and it makes absolutely no attempt to link to mechanism in any way.

It does have the advantage that you can make predictions for whether species you haven’t observed together (perhaps they’re in different continents) could potentially co-exist if given the chance. Since all species are put somewhere in the 2-D space, and species are only parameterised on the basis of species that overlap (via the ‘mask’ argument), if the space in some way reflects reality then position in it should have predictive power.

I worked on all this at a recent NutNet meeting. I was quite shocked at how nice everyone in the room was: they let a horrible data parasite like me just tag along for the ride, and I’m very grateful for it. So, if you’re a member of NutNet, thank you, and here’s that code I was working on during the meeting. I’m putting this up here in the spirit of how nice and friendly those guys were; a few people have expressed surprise that I put all these things that I work on here online before publishing them. Like it has for the people at NutNet, I’m hoping that being nice  pays off in the long-run.

Dataframes in Ruby: always double-check online

D’oh! If only I had checked beforehand! Courtesy of Simpson Crazy; apparently a hand-traced image and so OK for copyright…!

I absolutely love the Ruby programming language; I wouldn’t necessarily say I’m very good at it (or any language for that matter), but I always smile as I type ‘irb’ at a console. I find the language is more expressive, the naming conventions easy to use, and there are none of the silly indentation issues you find with Python. So, when faced with a solo project, I of course chose Ruby, and when I couldn’t find a reasonable data.frame gem (the Ruby equivalent of a package) I saw an opportunity, not a problem!

Behold! data_frame was born! Marvel! At how it’s very similar to a hash but with only a few extra features. Gaze adoringly! At how it can load CSV and Excel (xls and xlsx) files! Scream in shock! When you discover an identically-named package already available on rubygems, that happens to be much nicer (albeit without the Excel features). D’oh! If only I’d Googled more thoroughly earlier!

On a more positive note, I found the new GitHub-Zenodo integration really convenient for getting a citable DOI, and I’ll definitely be using that for all projects in the future. Moreover, making a gem (documentation and all) and getting everything ready took a single afternoon with a relaxed glass or two of wine. This is going from scratch, mind you, and included the time taken to re-install Ruby, get everything into the right gem format, figure out jeweler, and get everything online. I somehow can’t imagine having the same experience working with R…

Load that package! Etc.

I’m travelling back to the UK this weekend (yaaaaay!) and so, while I might write some (buggy) code on the plane, I thought it would be a push to get something new up this week. So, instead, I’ve “checked over” the willeerd package, and you can now install it like so:

require(devtools)
install_github(username="willpearse", repo="willeerd")

Tah-dah! My hope, in the next few weeks, is to have a few more posts with actual code within the page (like the above, but slightly less trivial). I might even veer off into posting about the usual sorts of R/ecology/evolution questions I get asked a lot, so if you have any preferences please do let me know!

Meta-Community Phylogeny Simulation 101

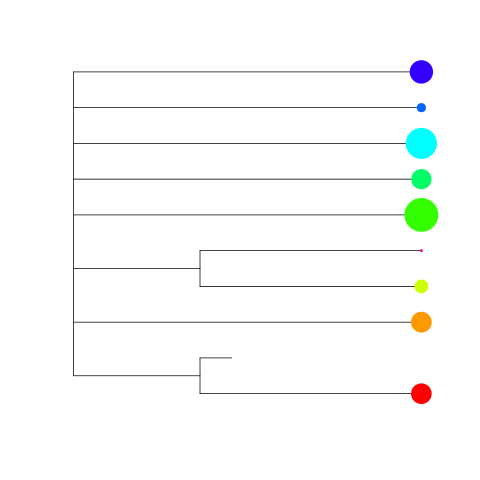
meta_phy

Example meta-community phylogeny. Circles are proportional to the number of individuals at the end of the run. Look! The species that died out isn’t anywhere at the end! I used rainbow to make this look slightly more appealing; I admit it’s not the prettiest figure in history.

Following on from the last post, I wrote a quick function that (sort of) simulates individuals of species moving through a meta-community (sim.meta.comm), and then added something on top that simulates the evolution of those species (including generating a phylogeny; sim.meta.phy.comm). I also neatened up the creation of a phylogeny from what I’ve been calling an ‘edge matrix’ in my code (edge2phylo). The meta-community has different environmental conditions throughout it, and individuals can migrate at each time-step. There’s no competition in the model yet.

I expected this to be a nightmare, but as long as you use the steps that monitor the ecology of the species as a check for whether you need to do anything with the phylogeny, it actually turns out that simulating the phylogeny is easier when you’ve got ecological information than when you’re just doing the phylogeny alone. In this version, I don’t have any effect of species traits – that’s for next time.

The main conceptual point I took from this is the difficulty in deciding how to model stochasticity. It’s hard to get the environmental parameters on the same scale as the stochasticity and species abundance parameters, and as such I ended up doing everything with Poisson distributions which seemed rather strange to me. It’s quite worrying how easy it was to make environments where species all headed to extinction, apart from in very, very small patches of the environment before I got my head around it all.

Next time – competition and trait evolution within the same model! Then, and only then, will I move on to actually trying to estimate parameters of interest from all this…

Phylogeny simulation 101

Species across a landscape, as simulate by Boucher et al. It's this pretty stained-glass-esque diagram that inspired me to do this!

Species across a landscape, as simulate by Boucher et al. It’s this pretty stained-glass-esque diagram that inspired me to do this!

Lots of people have written code to simulate phylogenies, and yet more have written code that simulate traits across phylogenies. I’m not claiming any great novelty in what I’ve just done, but sim.bd.tree simulates a phylogeny under given speciation and extinction rates, and sim.bd.tr.tree simulates a phylogeny, and a trait that affects speciation and extinction rate.

What I like about this is that the dependence on trait values is actually a dependence on what values of that trait other species have – in other words, it’s a niche-packing kind of model. Again, I’m not claiming any great novelty in these sorts of models (read this excellent paper, for example), but this was my first stab in what I hope will be a long stream of work. This is very raw code (a quick skim of it makes me realise a refactor would more than halve its length) but it does get the job done (I hope!).

My first impression is that this stuff isn’t very hard, so if you have any interest you should definitely give it a go. Moreover, the insight I gained from it was quite important – the shape and size of a phylogeny changes a great deal over different simulations, and while on some level I knew this it was only while checking to see if I’d messed something up that I really gathered a true appreciation for it.

Next post… either a model incorporating communities/biogeography (–> some model of allopatric speciation), or a vague attempt at fitting estimting the parameters I set once the phylogeny/traits are calculated. I have a feeling those two will be much harder!…

Taxonomic cleaning and building phylogenies

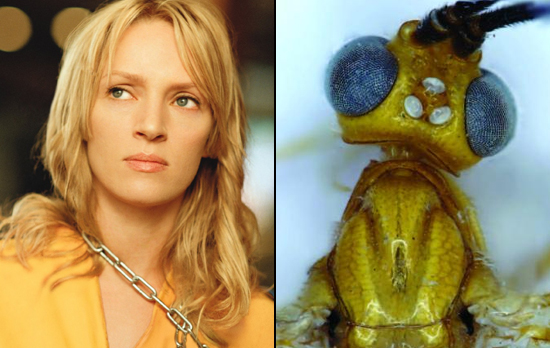
The Uma Thurman wasp, courtesy of crazy taxonomist Donald Quicke (well, he's not that crazy, but there we go). Via geekosystem.

The Uma Thurman wasp, courtesy of taxonomist Donald Quicke. Have you any idea how hard it is to find a picture to accompany a post on taxonomy cleaning? Via geekosystem.

I spend most of my time cleaning up species names, and using them to build phylogenies (have I screamed the word phyloGenerator at you recently?). However, most of the time if you’ve got a pretty small species set and you’re studying something well-known, you can get away without building a tree at all if you’re smart with how you match all the names up.

A number of people have been emailing me asking for my taxonomy scripts, and so I’ve now pushed some phylogeny making and taxonomic cleaning scripts (based heavily on the code that ships with phyloGenerator, so please cite that if you use it) into willeerd. It takes a list of plant names, cleans them up, and then sticks them into a phylogeny you specify (I’d recommend this plant phylogeny). You can also use the functions congeneric.merge and make.composite.with.polytomies to put missing species into any kind of phylogeny, either based on genus names or based on binding groups (intended to be genera) in to replace something else in a phylogeny. They all, by default, follow the bladj algorithm, which is a very fancy way of saying that inserted nodes are evenly spaced wthin a clade.

If you’re going to use these functions, please be careful. Taxonomy != phylogeny, and there is no guarantee that using taxonomy to fill in for phylogeny won’t cause major, major problems. Indeed, if taxonomy were sufficient to fill in for phylogeny, you should ask yourself why you’re even trying to use a phylogeny in the first place. The dating of nodes within a phylogeny is really hard, and while there are excellent methods to try and correct for a lack of information, it’s still really hard. I’d strongly recommend using a program that incorporates DNA data (like phyloG– OK, I’ll shut up), and even then be careful. This stuff is hard for a reason…!

As with the plotting functions I put up a few posts back, I use this code quite a lot myself, so please don’t be surprised if it changes in the coming days/weeks/months. Let me know if there’s anything in particular you’d like to see up there – I take requests (this post is one), so just let me know.

Kill your unit test fetish

They truly are everywhere.

They truly are everywhere.

I’ve been looked at strangely for saying that I’m not a big fan of unit testing. Since I don’t have time to write any code this week, I thought I’d formalise this a little. Let me start by saying, in big bold font, unit testing is really helpful and you should definitely do it.

Unit testing is a way of formally asserting that your code works. In R, we have the great testthat package, which allows your to say things like:

expect_that(my_new_factorial_function(3), equals(6))

…and you can be damn sure that your new factorial function will return the correct value when it’s given a value of 3. When working on big projects with lots of people it’s a great way of making sure nobody breaks someone else’s code; if all the tests pass at the end of your edits, everything is fine. It’s great for stuff only you are doing too – my shiny database must be right because all the tests assert test data is loaded correctly.

However, quantity is not quality when it comes to testing. Testing a function that computes a factorial twenty times to make sure it fails when given phylogenetic trees and character strings is not the same as testing to make sure the function works. Test the things that matter first – if someone’s going to pass your function a character string and they need a specific error for that, there’s probably nothing you can do. Achieving complete coverage of tests is no use if all of your checks are nonsense.

I think the most important thing in programming is writing good code, and that many have fetishised unit testing to the point where it’s no longer helpful for maintaining good code. So, in the spirit of being helpful, here are some general practices I think would make everything better:

  • Check the interactions.
    At a certain level, your code isn’t going to fail because you missed a comma somewhere, it will fail because two functions will interact in a way you hadn’t predicted (…and therefore couldn’t have written a test for). Check how the individual components of your program interact with one-another, and then (go nuts) write some tests for that.
  • Test your assumptions.
    If you know what will break your program, either fix it, or write a check for that conditions and make it fail gracefully. Everyone has confirmation bias – if you’re not finding errors when you thoroughly check your code with different input values, then you’re either the best programmer in the world or you’re not being honest with yourself. Find bugs and squash them, don’t write lots of line of tests that make you feel better about the bugs you’re pretending you don’t have.
  • Write DRY code.
    Don’t Repeat Yourself. You wouldn’t have to write so many damn tests if you abstracted and re-factored your code once in a while. Modularise everything so that you are quicker writing new things. The whole purpose of computers is to make our lives easier – grab discrete modules of code you know already work (and are tested), and use them to get your current task done.
  • Listen to feedback.
    When I leave a bug report, it’s because I’m hoping to help someone. Even if I’m being stupid, can you say in all honesty that you couldn’t make your program a little clearer? I often leave bug reports because I want to draw the authors’ attentions to things that could cause problems further down the line; these aren’t bugs, they’re just things that might be helpful. Such ‘bug’ hunters probably like you and your work, so chill out!
  • You’re not a developer.
    You’re a scientist. So you’re probably not going to be able to write meaningful tests and then write a program that fulfills them, because you’re exploring and treading new ground. Don’t worry about it – just make sure your code works. And yes, that probably means some unit tests.

Most of these pieces of advice involve unit testing. There’s a good reason for this: when done correctly, unit testing is helpful. When fetishised, it’s incredibly dangerous, because people think they can churn out more and more tests and so any kind of spaghetti code and all will be fine. I promise you, it won’t.